The Platform
Built to work
inside the real economy.
inside the real economy.
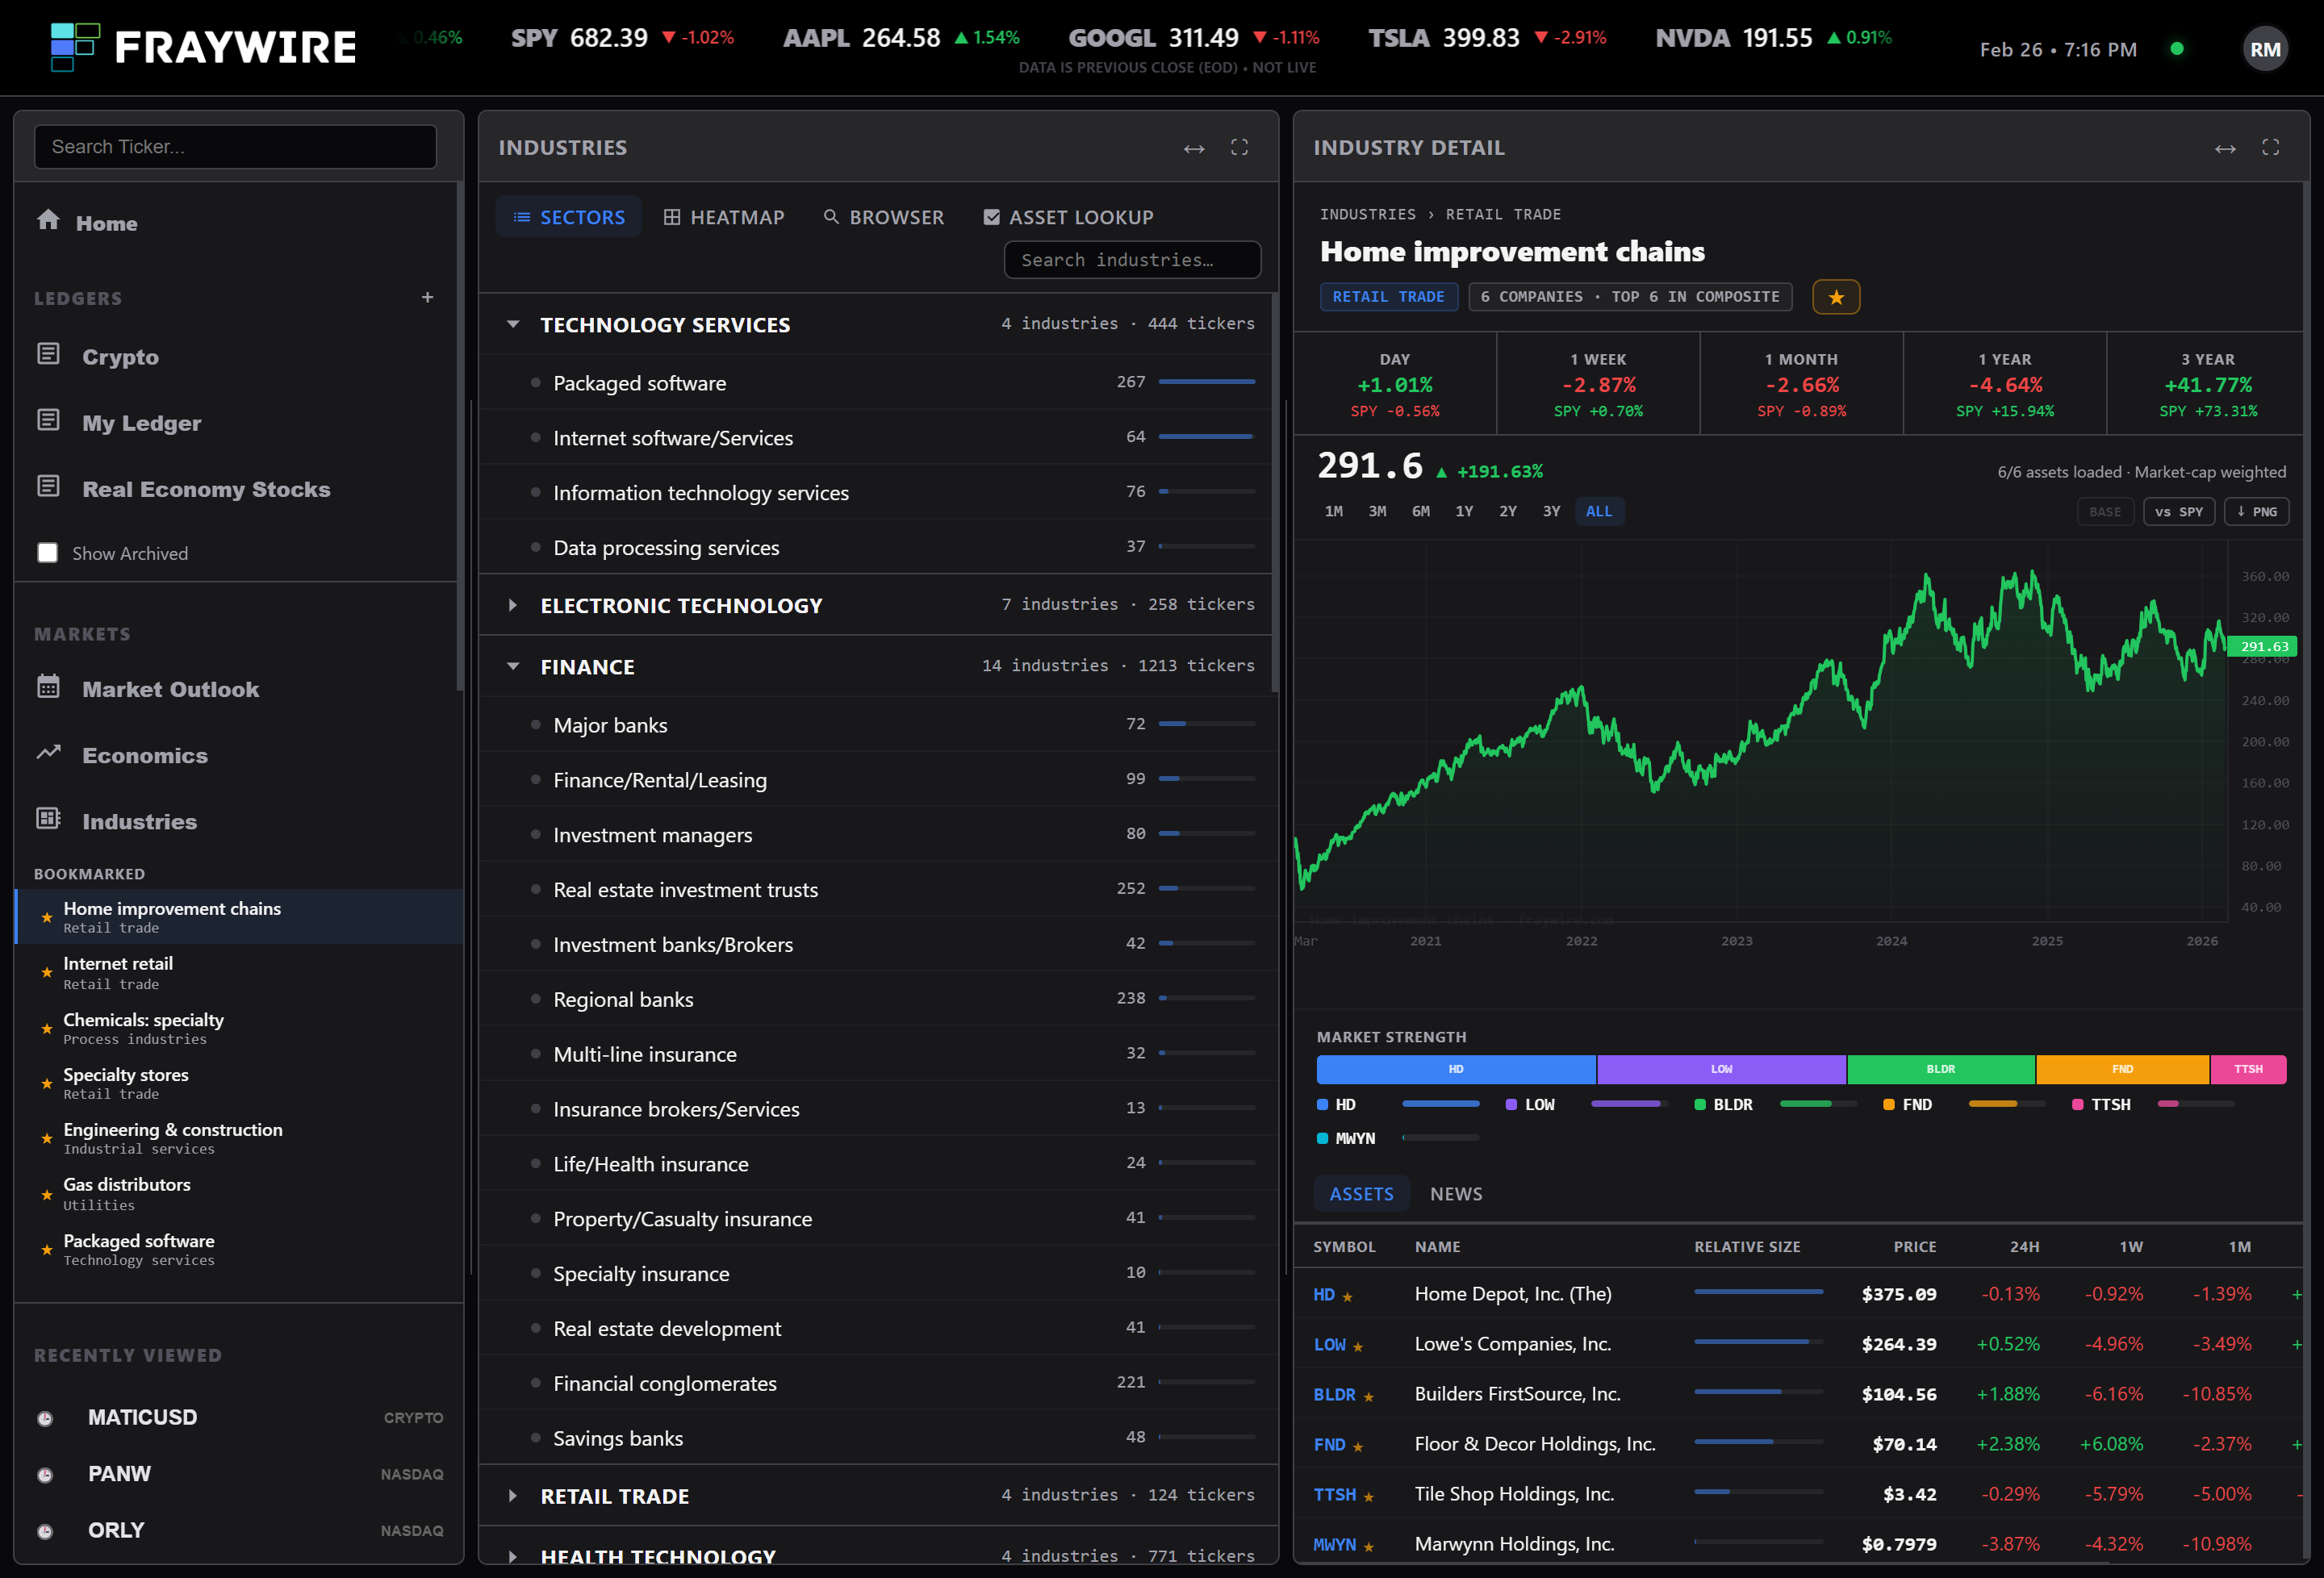
fraywire.com/dashboard
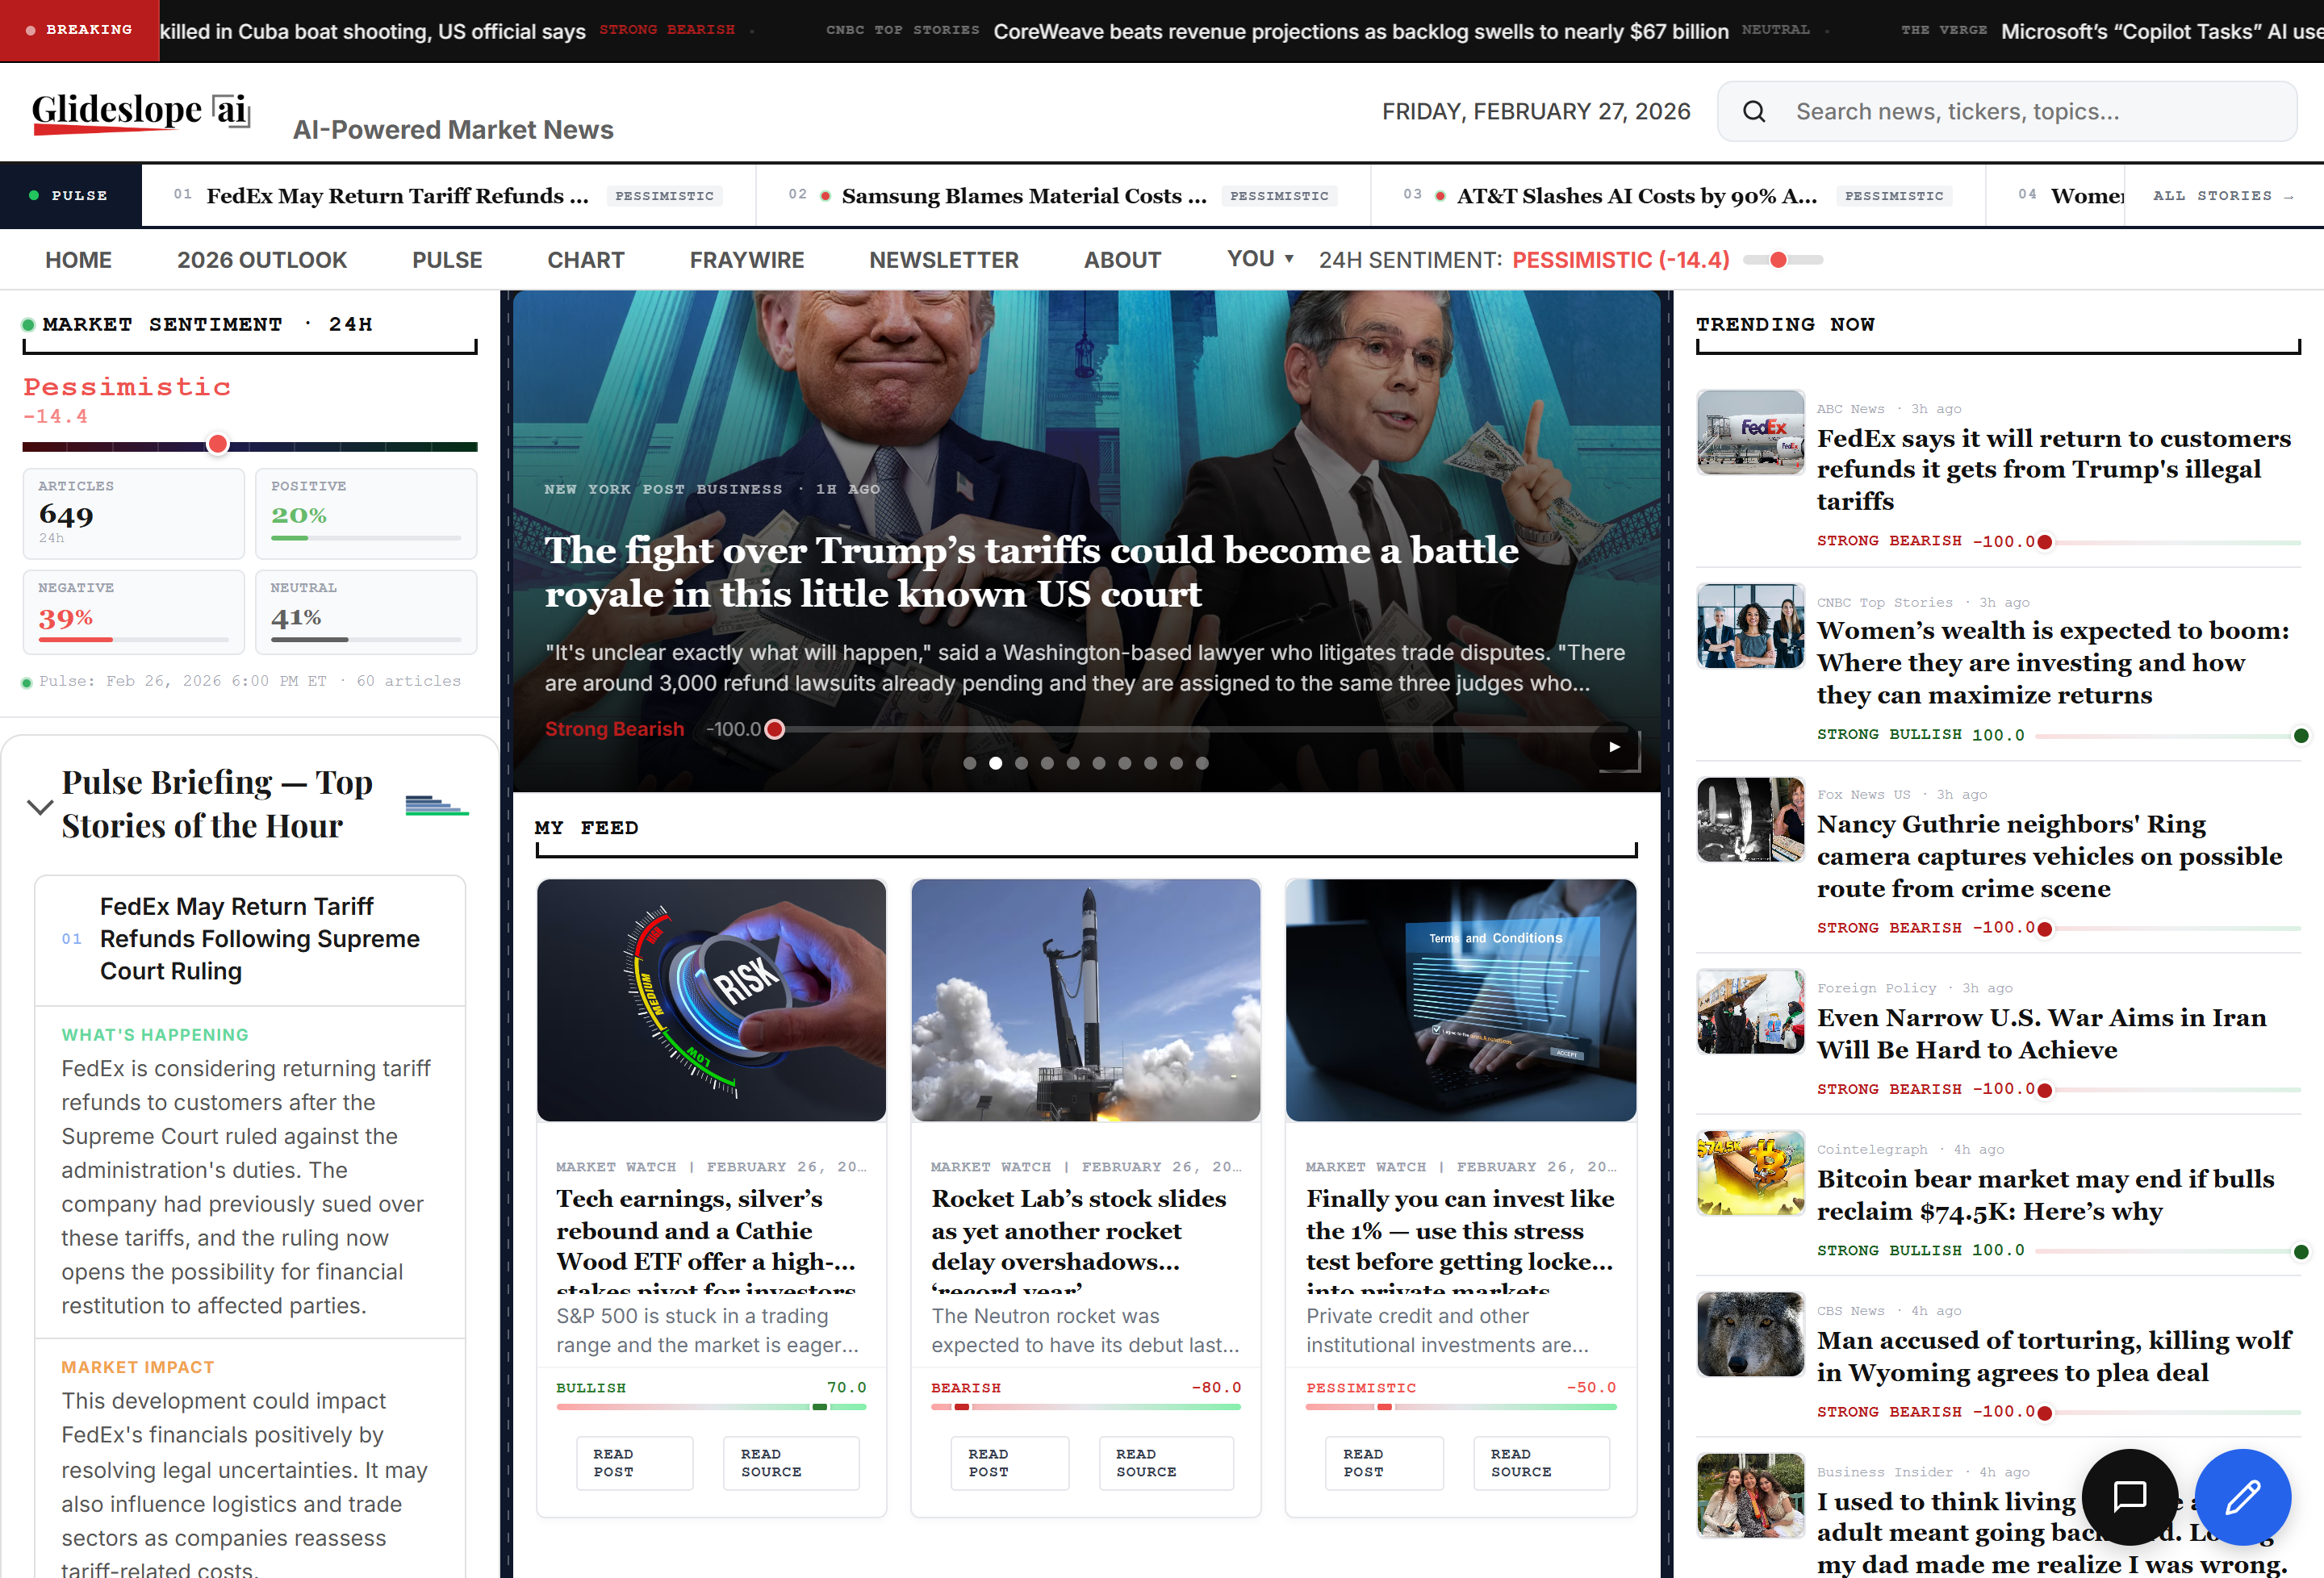
glideslope.ai
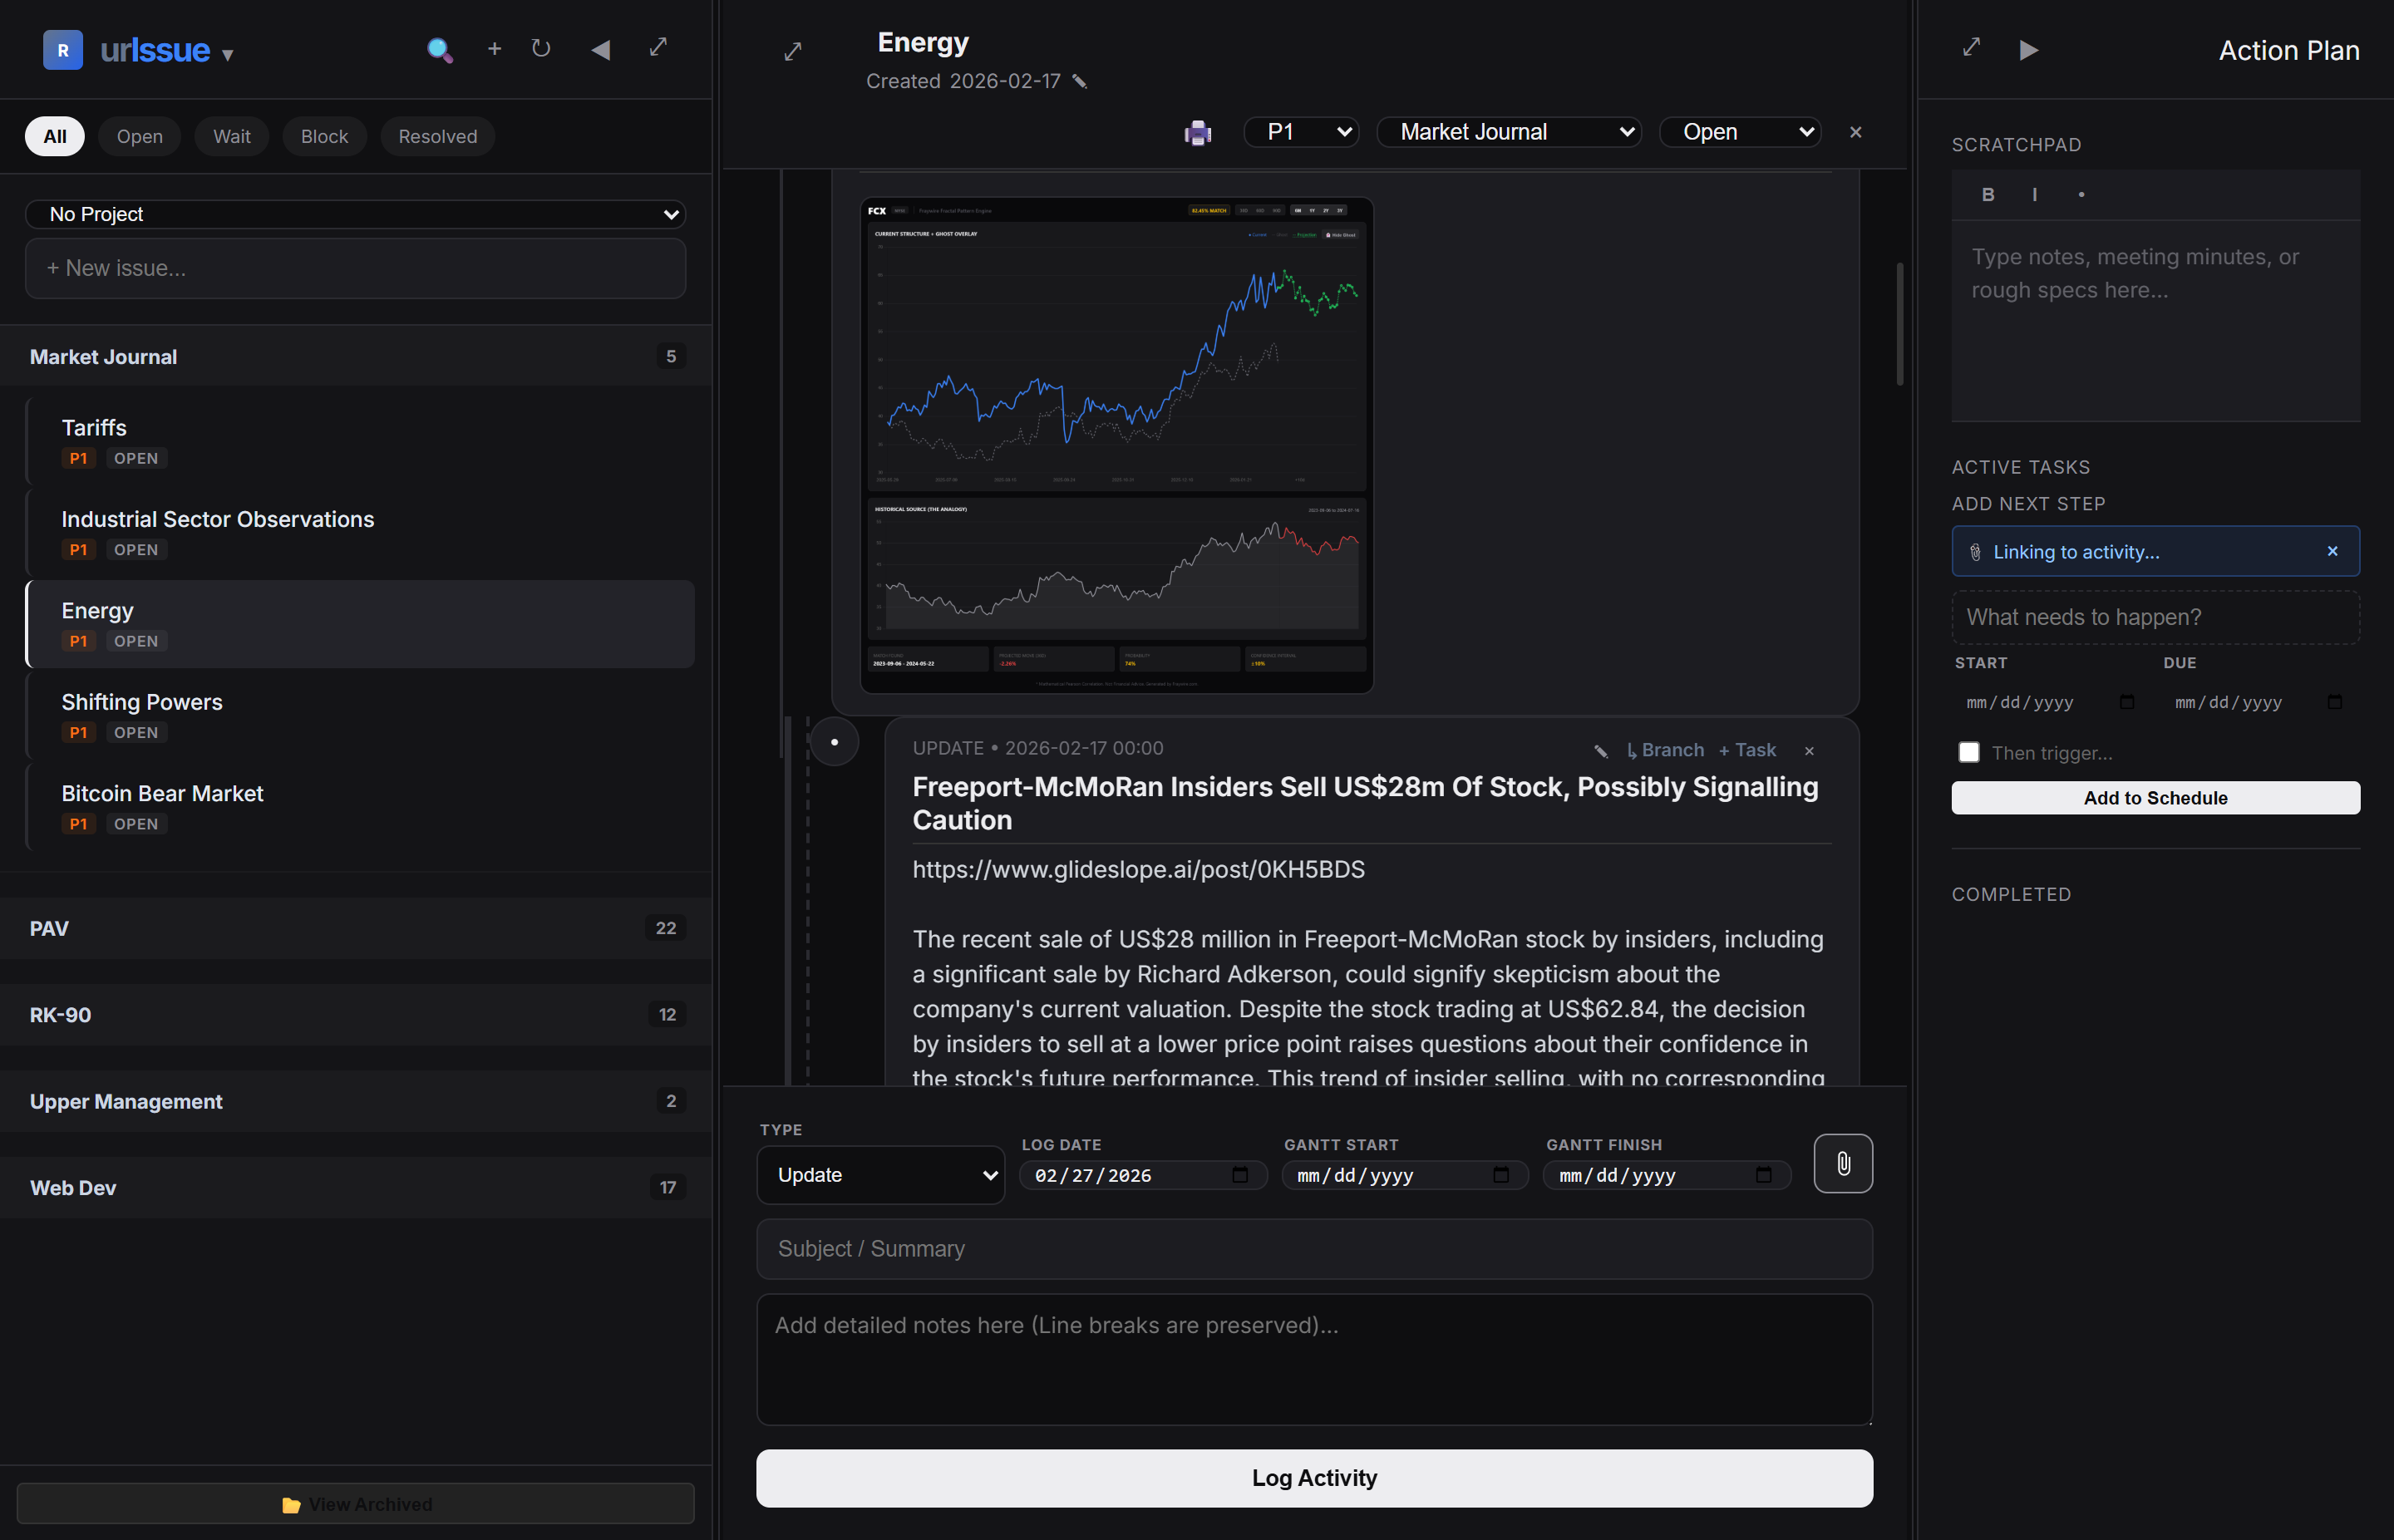
urissue.com/dashboard
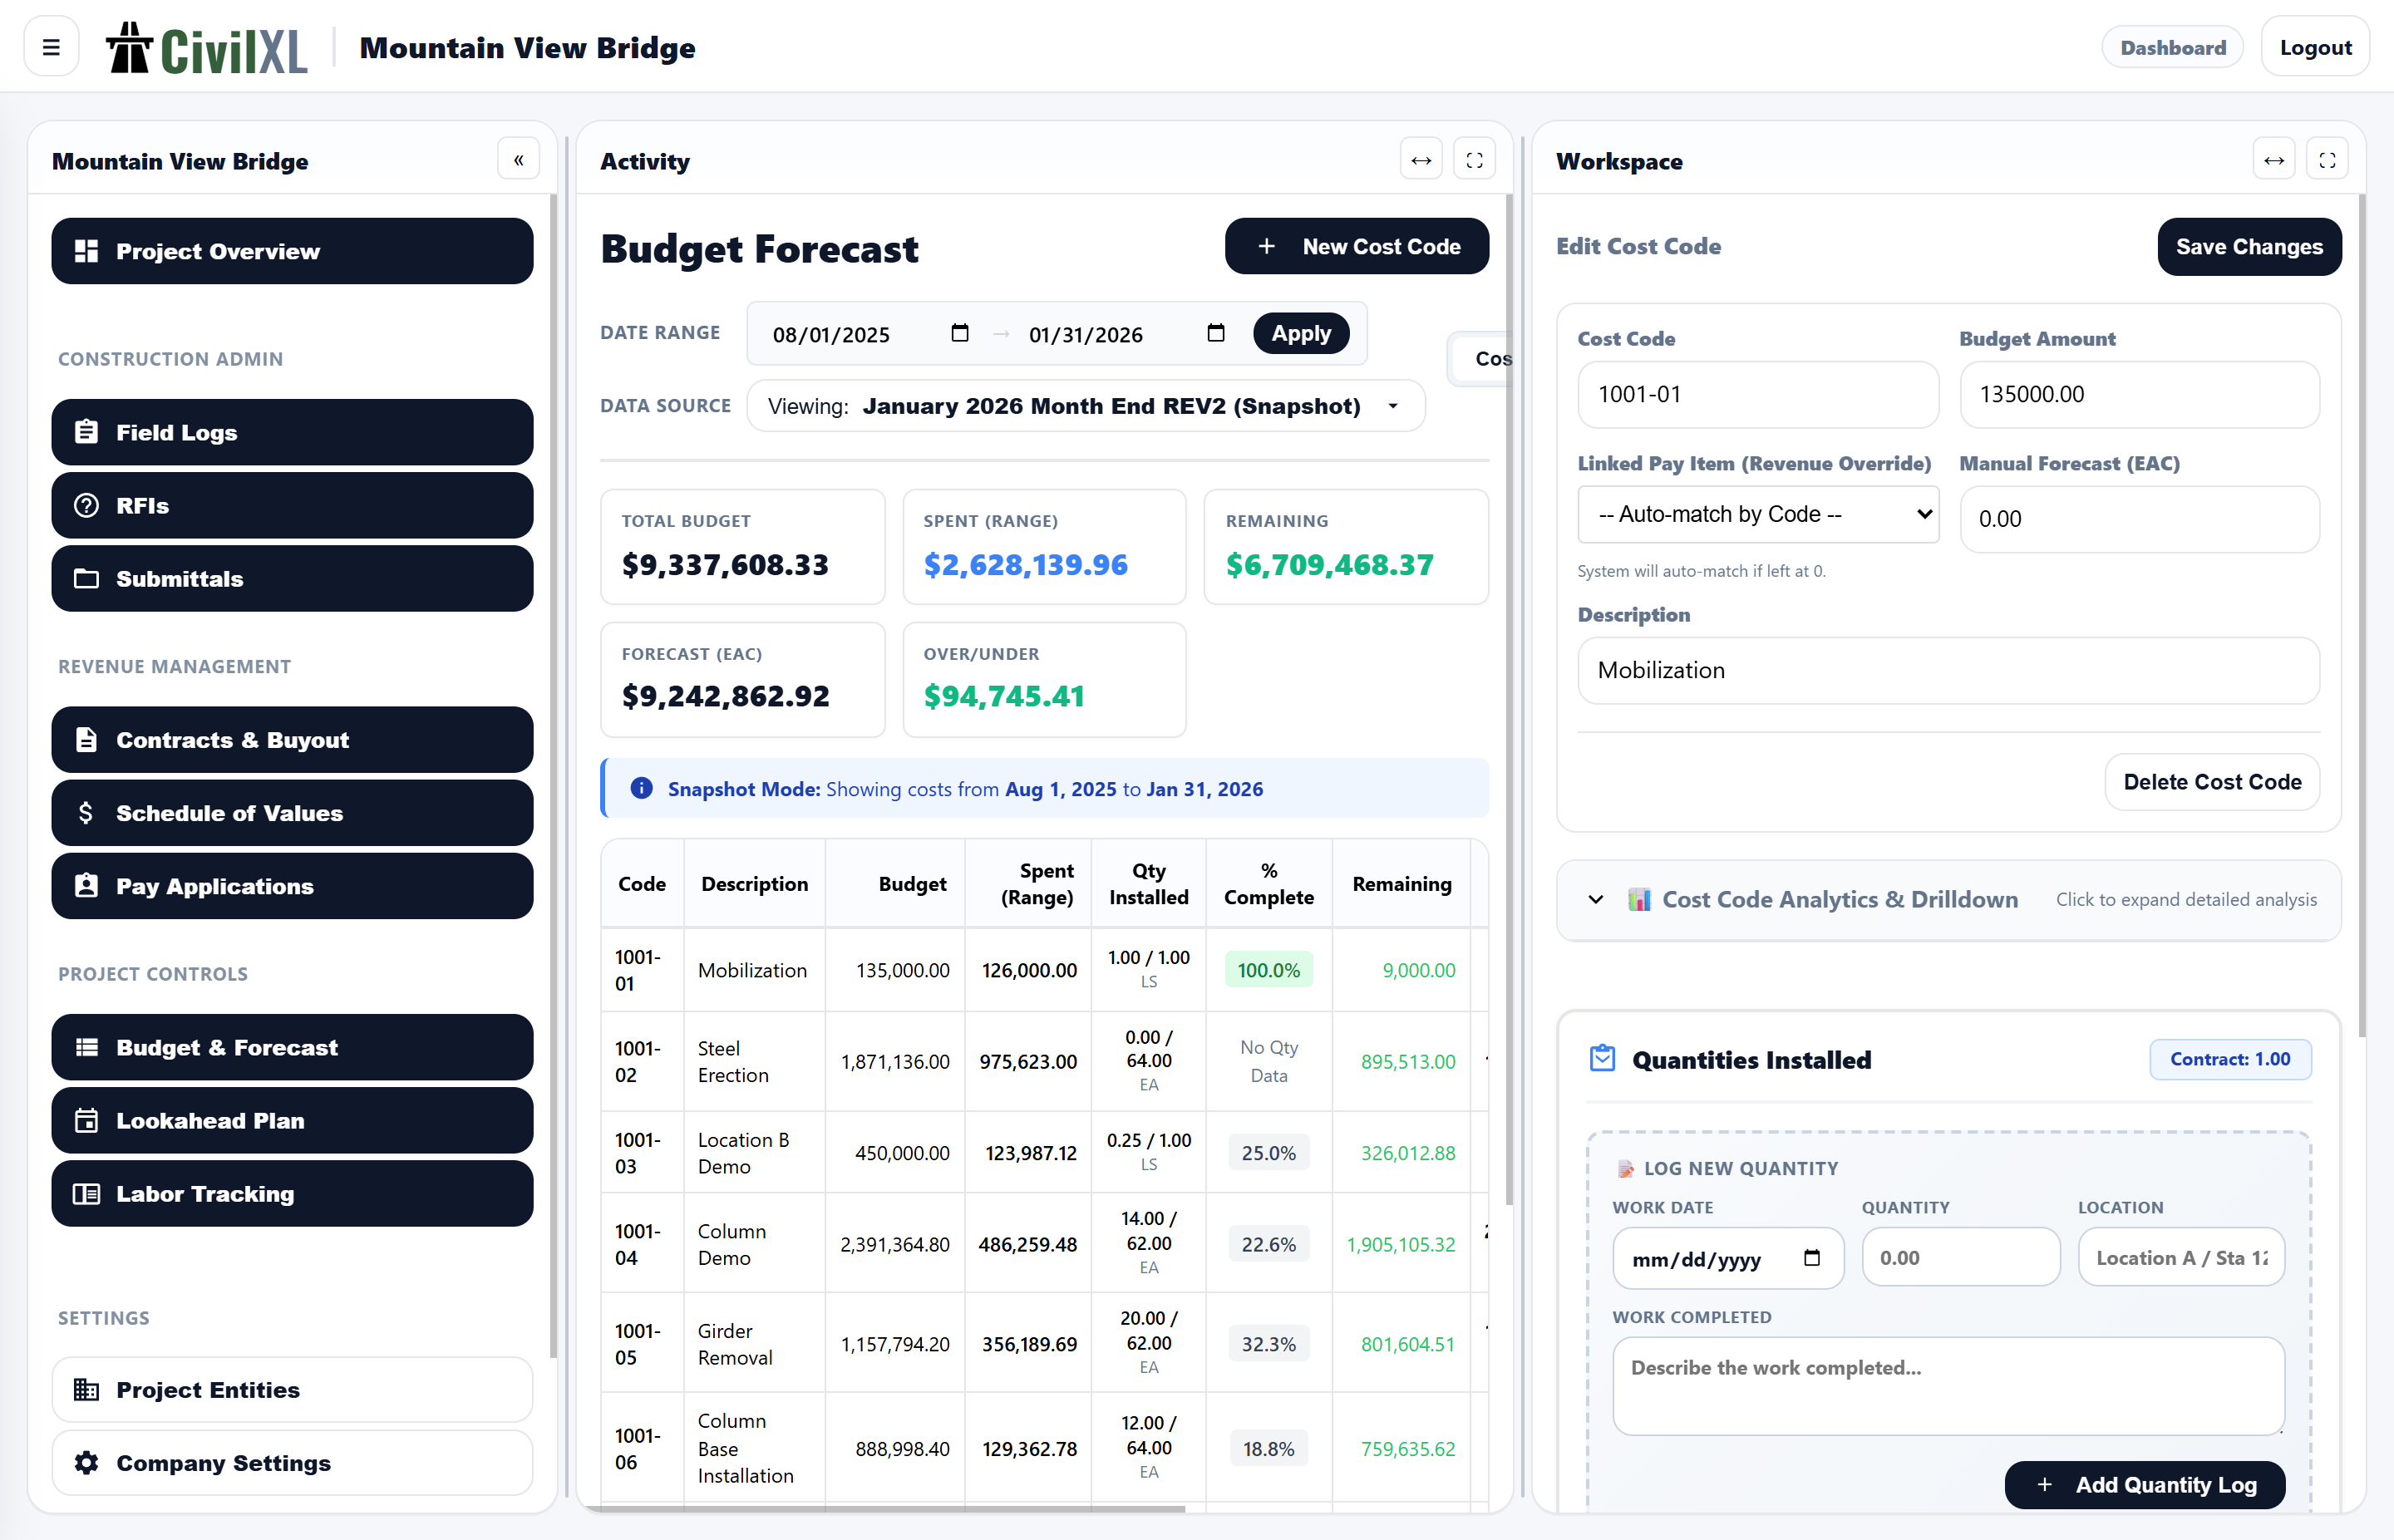
civilxl.com/dashboard