- Markets are rallying – albeit, small rallies
- Will retail investors get trapped? Are shorts incoming?
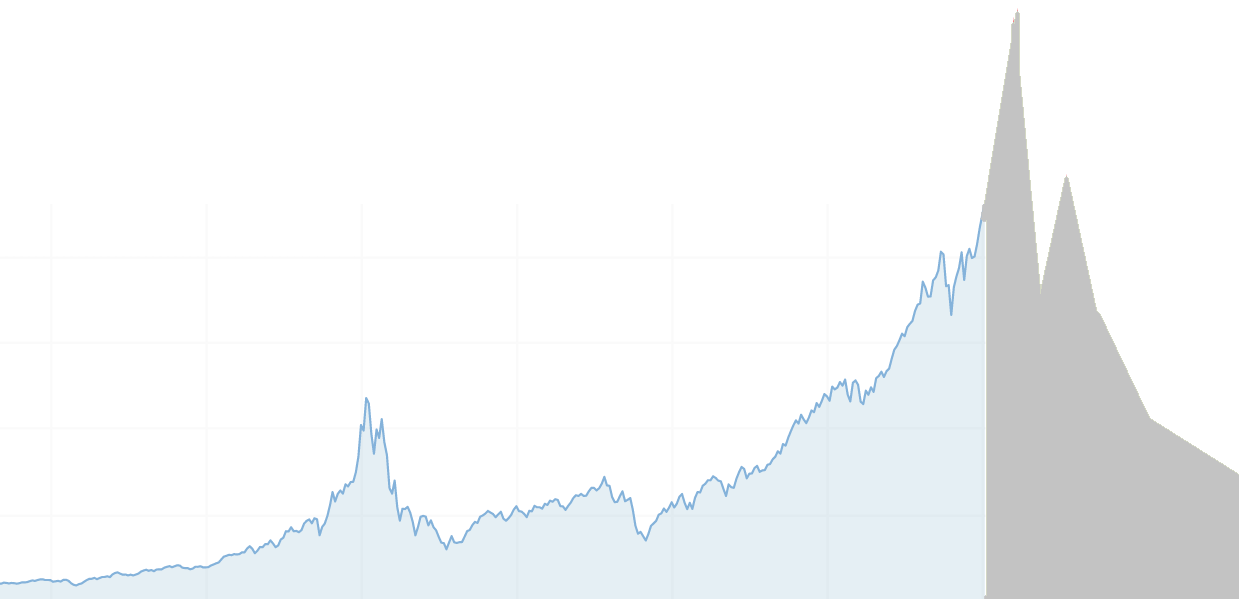
- ‘Markets are going to get rocked’ as Fed is likely to push rates higher, economist warns
- Is the crypto bottom in?
Stocks are pointing to a local bottom. Could this be the bottom of the market cycle? Or is this a sucker’s rally?
S&P 500 / $SPY
- Price is at a crucial level – since May, the S&P has been dancing around the red horizontal line bouncing off the downtrending grey line consistently.
- I’m not entirely bullish here until we see a significant breakout from both of these lines.
- A breakout from these trendlines will confirm accumulation – not a bull run.
Nvidia / $NVDA
- Price action is still forming an inverted right shoulder
- This price structure tells us we should see a move to the upside going into Spring this year
- There’s a little more room left for price to go down – we could still test $131 but the general trend seems to point upward
- An inverted Head & Shoulders structure coming off a downtrend is good sign that a bottom is in (or very close)
Global X Copper Miners ETF / $COPX
- The copper ETF appears to have made a double bottom
- Price is currently working its way to the uptrending grey line
- Also possible price bounces here to retest the neckline (dotted red) of the double bottom
- This price structure is another good indicator that the bottom is in or very close to being in
Altcoins and Bitcoin are all pointing to bottom structures. This could be it for the bears.
Bitcoin / $BTC
- Price has been bullish over the last couple weeks
- But there’s no confirmation of an actual recovery or incoming bull run
- Price is still navigating through the bearish pennant
- I won’t turn bullish until we see stronger candles around $18,360 that punch through resistance
Algorand / $ALGO
- Algorand formed a classic Cup & Handle pattern
- C&H patterns at lows like this are good indicators that the bottom is in
- These price structures are generally bullish
- If price bounces off the Target line and doesn’t accumulate around 21-cents, we can expect another move to the downside before getting too bullish
Polkadot / $DOT
- My target bottom for Polkadot was missed by 30-cents but price is moving in the general direction I expected
- RSI tells us the bottom is already in or very close
- Price has been oversold on the weekly RSI for over 6 months
- This is the bottoming structure I’m looking for to begin dollar-cost-averaging back in
Fraywire ⦿ Breaking Metrics ⦿ Merch Store ⦿ Resources ⦿ Follow on Twitter ⦿ Share this Newsletter
If you enjoy reading these posts, consider sharing ‘The Rebel Economist‘ with friends and family!
I dedicate a considerable amount of time researching the markets, so new subscribers are always appreciated (buying me a coffee is probably appreciated even more, so you have an option to donate a couple dollars every month if you enjoy the content). You can use the link in the button below to share with a friend or on social media.Subscribe to the Rebel Economist